In the wake of any sharp, downward move in the cryptocurrency market, a familiar narrative swiftly floods social media channels and forum threads: “market manipulation.” This accusation becomes a reflexive explanation for rapid price declines in assets like Bitcoin and XRP. It is a comforting story that assigns agency and blame to a shadowy “them.” The suddenness of the drop, the violation of widely watched technical levels, and the magnitude of liquidated positions combine to create a perception of deliberate, unfair action.
Yet, this narrative, while emotionally resonant, often obscures more than it reveals. It replaces mechanistic understanding with villain-centric folklore. For traders transitioning from spot markets to the complex world of derivatives, and for experienced users seeking clarity, the “manipulation” explanation is a conceptual dead end. It halts inquiry by providing a simple, if unverifiable, answer.
This article will not attempt to identify manipulators or allege wrongdoing by any exchange or entity. Such accusations require evidence that public market data cannot provide. Instead, we will reframe the discussion entirely. We will move from a paradigm of blame to one of structural analysis. The core thesis is this: What many traders interpret as coordinated manipulation is often the visible, and sometimes violent, outcome of the inherent mechanics within a derivatives-driven market structure. The leveraged instruments that dominate crypto trading—perpetual futures, options, and margin products—create a financial ecosystem with unique physics. Understanding these physics—liquidation cascades, liquidity hunting, and leverage imbalances—is the first step toward market literacy in modern crypto.
Key Points
-
Many sharp price moves are blamed on manipulation, but they are more accurately explained by derivatives market mechanics rather than illegal or coordinated activity.
-
For major crypto assets, perpetual futures and leveraged positions often drive price movement. The spot market typically reacts after derivatives have already moved.
-
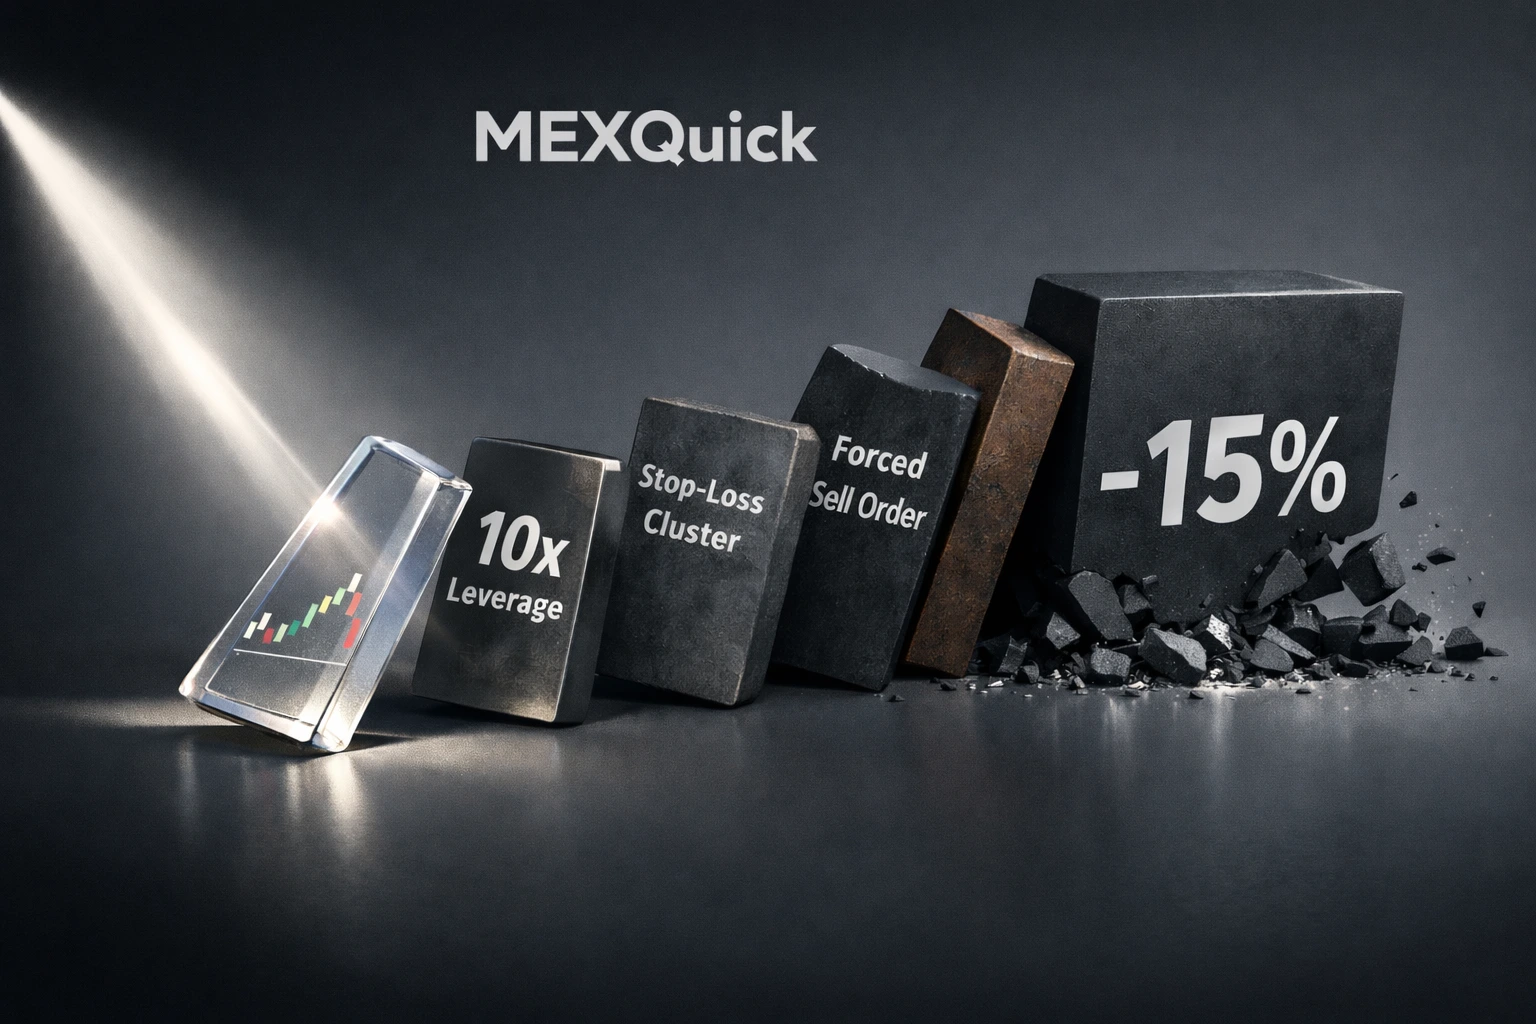
A small price decline can trigger forced, algorithmic sell orders from over-leveraged positions, creating a rapid, self-reinforcing crash without any single actor controlling it.
-
When price briefly breaks obvious technical levels, it is often sweeping clustered stop-loss orders. This is a result of collective positioning and liquidity dynamics, not targeted wrongdoing.
-
The rules of derivatives markets (funding rates, margin requirements, liquidations) are transparent. Extreme moves are a natural outcome of high leverage, thin liquidity, and imbalance.
Why “Market Manipulation” Is a Misleading Term in Crypto
In financial markets, market manipulation formally refers to intentional conduct designed to deceive participants by artificially controlling or affecting an asset’s price. This can include illegal practices like wash trading, spoofing, or pump-and-dump schemes intended to create a false appearance of activity. In crypto discourse, however, the term has been stretched far beyond this legal definition. It is now commonly used to describe any sudden, large price move that causes significant losses, particularly for retail traders.
The term “manipulation” carries significant legal weight in traditional finance. It implies a deliberate intent to deceive the market, often through fraudulent acts like spoofing (entering fake orders) or wash trading (trading with oneself to create false volume). Regulatory bodies pursue such actions with substantial resources. In the crypto lexicon, however, “manipulation” has been colloquially stretched to describe almost any significant, unexpected price move that causes losses, particularly for leveraged traders.
This conflation is problematic. It equates volatility with malice. Cryptocurrency markets, especially those for derivatives, are globally traded, highly leveraged, and operate 24/7 with relatively lower spot liquidity than mature asset classes. These conditions naturally breed high volatility. A 10% move in the S&P 500 is a historic event. A 10% move in Bitcoin can occur within an hour on a quiet weekend. This inherent volatility is amplified exponentially by the use of leverage, distorting participants’ perception of normal market function.
Furthermore, the very structure of crypto derivatives amplifies the visibility of large moves. In a spot market, a large sell order moves price as it consumes the available buy-side order book. The move ends when the order is filled. In a derivatives market, that same directional price move can trigger a chain reaction of forced, automated sell orders (liquidations) that far exceed the original catalyst. The resulting price action is not a separate, manipulative act. It is a direct, mechanical consequence of the market’s built-in risk management systems.
The appeal of the manipulation narrative is psychological. It externalizes failure. A bad trade becomes not a miscalculation of risk, leverage, or timing. It becomes the victimization of a retail trader by a powerful, unseen adversary. This mindset prevents a critical examination of one’s own positioning within a dangerous market structure. It shifts focus from the controllable such as risk management, leverage size, position timing, to the uncontrollable and often illusory. Recognizing that sharp moves can emerge organically from market mechanics, without a central puppeteer, is the first step toward trading with clarity rather than trading with a grudge.
Where Crypto Prices Actually Move? The Derivatives Layer
To understand modern crypto price action, one must first recognize a pivotal shift. For major assets like Bitcoin and Ethereum, the primary arena for price discovery has migrated from the spot market to the derivatives layer. While spot trading (the immediate exchange of the asset) provides foundational liquidity, the immense volume and leverage in perpetual futures and quarterly futures contracts often dictate the direction and velocity of price.
The difference is profound. A spot market transaction is a simple exchange: asset for currency. Its impact is generally confined to the order book’s depth. A derivatives trade, however, is a contract for future settlement. It is often entered with significant leverage, borrowed capital that amplifies both gains and losses. This creates a complex web of interconnected positions, collateral, and conditional orders that hangs over the spot price like a gravitational field.
Three derivatives metrics are crucial for mapping this terrain:
-
Open Interest (OI): The total value of all outstanding derivative contracts. Rising OI indicates new money and new positioning entering the market. High OI represents a large amount of potential energy. It signals that many leveraged positions exist that will eventually need to be closed, either voluntarily or by force.
-
Funding Rates (for Perpetual Swaps): A periodic payment between long and short positions designed to tether the perpetual contract price to the spot index. Positive funding (longs pay shorts) suggests bullish leverage dominance. Extreme positive funding can indicate overcrowded long leverage. This creates a vulnerable, unbalanced market structure.
-
Leverage Distribution: The concentration of positions at specific leverage multiples. Exchanges provide data on how much leverage is being used across their user base. A high concentration of positions using 20x, 50x, or 100x leverage represents tinder waiting for a spark.
In this environment, the spot market often plays a reactive role. A large directional move may initiate in the futures market due to a large leveraged position entering or exiting. As the futures price moves, arbitrageurs (algorithmic traders) step in to profit from the difference between the futures price and the spot price. They do this by buying the spot asset and selling the futures contract (or vice versa). This process pulls the spot price to align with the futures price. Thus, the tail (derivatives) often wags the dog (spot).
This derivatives-led dynamic explains why news or events can trigger disproportionate moves. The news itself is not the engine; it is the catalyst that nudges a massively leveraged, unbalanced system. The real engine is the subsequent chain reaction within the derivatives structure itself. This chain reaction has a precise name and a predictable sequence: the liquidation cascade.
Liquidation Cascades: The Mechanical Engine Behind Sharp Moves
The most consequential—and most misunderstood—feature of a leveraged market is the liquidation cascade. This is the non-manipulative, rule-based mechanism that turns a minor price decline into a precipitous crash. It operates with the cold logic of an automated risk engine, not the cunning of a malicious actor. Let’s break down the process step-by-step.
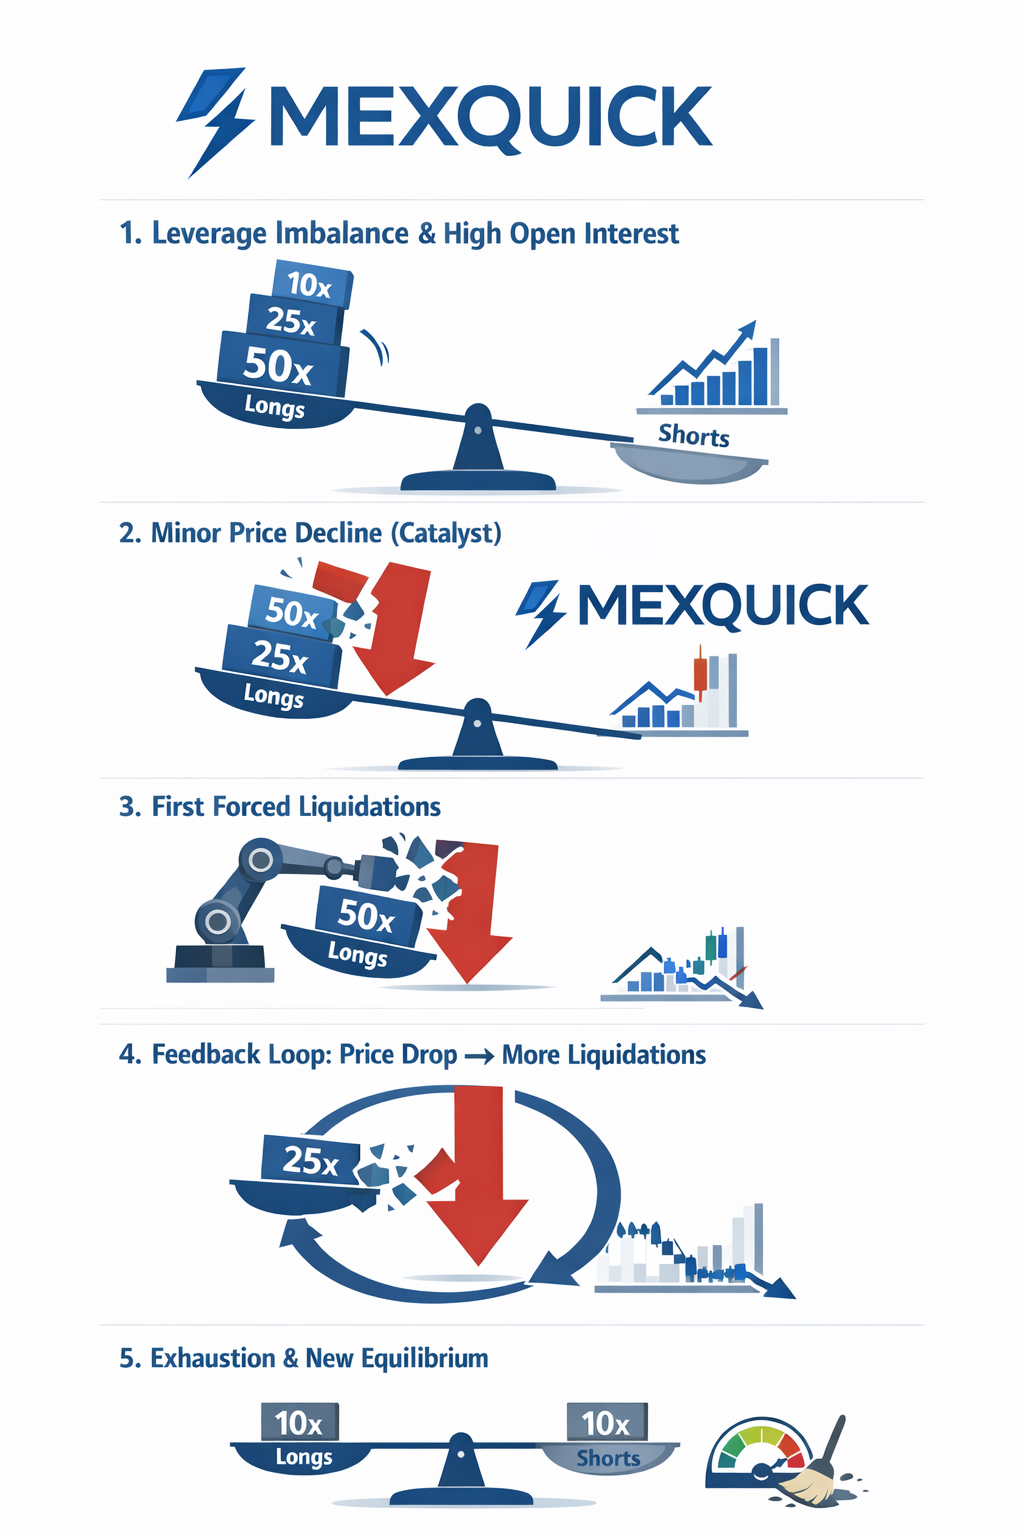
Phase 1: Leverage Accumulation & Imbalance
The stage is set during a trending market. In an uptrend, for example, bullish sentiment grows. Traders increasingly use leverage to amplify gains. Funding rates turn and remain positive. Open Interest climbs. Critically, the market becomes unbalanced. The value of leveraged long positions far exceeds that of leveraged short positions. This creates a one-way skew in market exposure.
Phase 2: The Minor Directional Push
A catalyst emerges. It could be a negative news headline, a large sell order in the spot market, or simply the natural ebb of buying pressure. This catalyst pushes price down by a few percentage points. In a spot-only market, this might be the end of the story. In a leveraged market, it is just the beginning.
Phase 3: The First Wave of Liquidations
That initial drop pushes the most highly leveraged long positions into negative equity. These are the positions clinging to the edge of solvency. Exchange risk engines automatically close these positions to prevent the trader’s loss from exceeding their collateral (going “bankrupt” and owing the exchange). This is a forced market sell order. It is not a discretionary decision by the trader; it is an algorithmic execution triggered by price.
Phase 4: Volatility Acceleration and The Cascade
These forced sell orders add new, aggressive selling pressure to the market. They hit the order book, pushing the price down further. This next leg down triggers the next tier of long positions. Their positions are liquidated, creating more market sell orders. This creates a self-reinforcing feedback loop: price drop → liquidations → more selling → further price drop → more liquidations.
The cascade continues, accelerating as it falls. It stops only when it exhausts the over-leveraged long positions. It can also halt when it reaches a price level where substantial spot buying or new short-covering emerges to absorb the selling pressure. The entire event can unfold in minutes. It erases billions in notional open interest and leaves a chart with a nearly vertical red candle. No single “whale” or manipulator needed to engineer the entire move. They may have provided the initial nudge, but the market’s own structure provided the cliff.
Stop Hunts, Liquidity Zones, and the Failure of Obvious Levels
Technical analysis is a cornerstone of crypto trading. Traders identify key support and resistance levels. These are prices where buying or selling pressure is historically expected to emerge. They then place stop-loss orders just below support (to exit a long trade) or just above resistance (to exit a short trade). This is prudent individual risk management. Collectively, however, it creates a predictable vulnerability in the market’s microstructure.
When a large number of stop-loss orders cluster below a well-publicized support level, that zone transforms from a “floor” into a liquidity pocket. For market makers, institutional traders, and algorithmic systems, these clusters represent pools of guaranteed execution. “Liquidity” in this context doesn’t mean the ability to buy easily. It means a concentration of resting orders that can be taken to enter or exit a large position efficiently.
This leads to the phenomenon colloquially known as a “stop hunt.” Price may drift toward a key support level. As it approaches, the selling pressure from the initial move may begin to wane. However, the liquidity sitting just below the level presents a target. A wave of selling pushes price through the support level. This triggers the cascade of stop-loss orders.
These stops are market orders. They sell at whatever price is available. Their activation causes a rapid, often brief, downward spike that sweeps through the liquidity pocket. Once these orders are filled and the selling exhausts itself, the original impetus for the move may have passed. With the over-leveraged longs liquidated and the weak-handed hands stopped out, buying can re-enter the market. This leads to a sharp “V-shaped” recovery. To the trader whose stop was hit before price reversed higher, this feels uniquely malicious.
In reality, this is a function of market depth and collective positioning. The market is not a sentient being seeking to punish individuals. It is a system where large participants necessarily seek liquidity to manage their risk. Liquidity tends to aggregate at the same technical levels where retail crowds place their stops. The failure of obvious levels is not a conspiracy. It is a near-inevitability in a market where everyone sees the same chart. Recognizing this shifts the trader’s task from simply identifying levels to understanding the liquidity landscape around those levels. This structural dynamic plays out across all crypto assets, but its visible impact varies dramatically depending on an asset’s specific characteristics, as seen in the contrasting behaviors of Bitcoin and XRP.
Bitcoin vs XRP: Same Market Structure, Different Sensitivities
Applying this structural lens to different assets clarifies why they behave differently. Bitcoin and XRP both trade within the same overarching crypto derivatives ecosystem. Their price action often elicits contrasting descriptions. Bitcoin’s moves are seen as “mechanical” or “institutional.” XRP’s are often labeled “erratic” or “manipulated.” The difference lies not in the presence or absence of manipulation. It lies in the underlying market microstructure and participant psychology.
Bitcoin: The Deep, Leveraged Benchmark
Bitcoin boasts the deepest spot and derivatives markets in crypto. It has the highest open interest, the most liquid order books, and the broadest participation from institutional entities, ETFs, and dedicated funds. This depth means larger amounts of capital are required to move its price by a given percentage. However, its immense leverage market means that when moves do occur, the liquidation cascades are correspondingly larger in notional value.
Bitcoin’s price is more tightly coupled to macro financial narratives. These include inflation, ETF flows, and monetary policy. Its corrections often appear “orderly” in a relative sense. They follow clearer technical pathways and liquidate over-leveraged positions in a way that seems consistent with derivatives mechanics. The narrative around Bitcoin is one of digital gold and a macro asset. This attracts a different type of leveraged positioning, often more systematic or longer-term.
XRP: The Shallow, Narrative-Driven Asset
XRP, while a large-cap asset, operates with notably different parameters. Its spot market depth is shallower than Bitcoin’s. Its derivatives market, while significant, is often dominated by retail sentiment and specific legal or regulatory news related to its ongoing SEC case. This combination creates a more volatile baseline.
A price move of the same dollar magnitude requires less capital in XRP. This makes it more susceptible to large single orders or coordinated group actions. More importantly, its participant base is highly reactive to headlines. Positive legal news can trigger a frenzy of high-leverage long positioning. Any subsequent negative development can then trigger a violent liquidation cascade that appears disproportionate. The “narrative sensitivity” of XRP traders amplifies the leverage imbalance phases described earlier.
The key takeaway is that different behavior does not imply different manipulation. Both assets are subject to the same fundamental laws of liquidation cascades and liquidity hunting. XRP’s lower liquidity and higher narrative sensitivity simply make these mechanics more pronounced and visually dramatic on the chart. The market structure is the same theater. XRP’s stage is smaller, and its actors are more prone to melodrama. This makes the plot twists seem more sudden and extreme.
Why These Dynamics Intensify After Major Corrections
The perception of unfairness and manipulation peaks in the aftermath of a major correction. This is not coincidental. The structural conditions that facilitate sharp moves are most prevalent during and after these periods. Understanding this post-correction environment is crucial for contextualizing the narrative cycle.
Post-Correction Psychology and Thinning Liquidity
Following a significant drop, market psychology is fragile. Confidence is shaken. Traders who were liquidated or stopped out may retreat to the sidelines. This leads to a critical phenomenon: liquidity thinning. Market makers and liquidity providers widen their spreads to account for higher volatility and risk. The resting buy orders in the order book become shallower and further from the market price.
In this environment, the same amount of selling pressure produces a larger price impact. A liquidation cascade that might have been absorbed by deep bids in a confident market now slices through a thin order book with ease. This thinning effect makes subsequent moves feel more violent and unpredictable. It feeds the manipulation narrative.
The Timing Effect: Weekends, Nights, and News Voids
Crypto markets never close, but human attention does. Liquidity is often at its thinnest during weekends and during off-hours for major financial centers. Large, leveraged positions remain open during these periods. The capacity of the order book to absorb large trades is diminished.
A catalyst during these low-liquidity windows can therefore trigger an exaggerated move. The resulting liquidation cascade meets little resistance. It creates a dramatic, jarring candle on the chart that seems to come “out of nowhere” for traders who were not watching. This temporal vulnerability is a structural feature of 24/7 markets. It is not evidence of a coordinated attack.
The Feedback Loop of Narrative and Structure
Finally, the “manipulation” narrative itself becomes a market factor. As the belief spreads, it fosters distrust and a shorter-term, more speculative mindset among participants. This can lead to faster position turnover. It encourages a greater reliance on tight stop-losses, creating more clustered liquidity pockets. It fosters a reluctance to provide deep liquidity. In this way, the collective belief in a manipulative market can contribute to creating a market that is indeed more prone to the violent, liquidity-seeking moves that fuel the very belief.
Rethinking Market Fairness in Derivatives-Driven Crypto Markets
The journey from blaming manipulation to understanding structure inevitably leads to a philosophical question: Is this market fair? The answer depends on one’s definition of fairness.
If fairness means a level playing field where all participants have equal information, capital, and influence, then no financial market has ever been fair. Crypto derivatives are certainly not an exception. Large players with superior infrastructure, data feeds, and collateral management will always have advantages.
However, if fairness means a market with transparent rules that are applied consistently, then the picture changes. The liquidation engines on major exchanges are not secret. The rules for funding rates, margin calls, and position closure are published. The mechanics described in this article are not hidden. They are the logical outcomes of operating a market with extremely high leverage.
The crypto derivatives market is not inherently unfair; it is inherently unforgiving. It punishes inattention, excessive leverage, and poor risk management with swift and brutal efficiency. It rewards structural awareness, patience, and capital preservation. This unforgiving nature is often mislabeled as unfairness. The market does not care about your narrative, your conviction, or your need for profit. It is a system of equations, collateral ratios, and conditional orders playing out in real-time.
Shifting one’s mindset from seeking “fairness” to respecting “mechanics” is a profound leap in trading maturity. It moves the locus of control inward. Instead of lamenting an unjust system, the structurally-aware participant focuses on the controllable variables. These include their own leverage ratio, their position size relative to portfolio, and their placement of stop-losses away from obvious liquidity clusters.
Takeaways: From Blame to Market Literacy
The recurring “market manipulation” narrative that follows corrections in Bitcoin, XRP, and other cryptocurrencies is a symptom of a broader gap in understanding. It is a placeholder explanation for complex, leverage-driven market dynamics. These dynamics are not intuitively obvious, especially to those schooled primarily in spot trading.
As we have detailed, the real mechanics are structural and self-reinforcing. Prices move decisively in the derivatives layer, where leverage accumulates into imbalances. Minor catalysts trigger rule-based liquidation cascades. These are accelerated by the clustering of stop-loss orders at technically obvious levels. Assets behave differently based on their liquidity depth and participant base. However, they operate under the same fundamental principles.
Blaming manipulation is an act of intellectual surrender. It is a choice to remain in the dark, attributing one’s outcomes to the whims of unseen villains. Embracing market structure literacy, by contrast, is empowering. It does not guarantee profitability but it dramatically improves decision-making. It allows a trader to assess risk not just through a chart pattern, but through the lens of open interest, funding rates, and the liquidity landscape.
The modern crypto market is a derivatives market first. Its volatility is not an aberration; it is a feature of its leveraged design. To participate in it is to engage with a system that is transparent in its rules yet ruthless in their application. The path forward is not to demand a different, gentler market. It is to develop the knowledge required to navigate the one that exists. The final move away from blame and toward understanding is perhaps the most critical trade any participant can make.