The decentralized and always-on nature of the cryptocurrency market often leads new traders to believe it operates without the rhythmic pulses found in traditional finance. However, this perception overlooks a crucial element: human participation and institutional capital flow. While crypto exchanges never truly close, the activity within them ebbs and flows dramatically according to global trading hours, particularly those of the major financial centers in Asia, London, and New York. Understanding these “market sessions” is not about predicting price, but rather about comprehending the underlying shifts in liquidity, volatility, and market microstructure that occur throughout the 24-hour cycle. This article will deconstruct how these legacy session timings influence the seemingly boundless crypto market, providing an educational framework for recognizing periods of high opportunity and increased risk. This analysis is for educational purposes only and should not be construed as financial advice or trading recommendations.
What Are Crypto Market Sessions and Why They Matter
In traditional financial markets, “sessions” refer to the specific hours when major exchanges in different regions are open for trading. For instance, the London Stock Exchange operates during distinct hours, as do the New York Stock Exchange and the Tokyo Stock Exchange. These sessions concentrate liquidity and activity within defined windows.
While the crypto market operates 24/7/365, it doesn’t mean activity is uniformly distributed. Instead, market participants, particularly large institutional players, still largely adhere to their regional business hours. This means that when Tokyo and Hong Kong are active, Asian liquidity dominates. When London awakens, European capital floods in, and similarly for New York. These periods bring distinct characteristics to the market:
- Liquidity Shifts: Major financial centers have vast pools of capital. When these centers are active, more orders are placed, leading to tighter bid-ask spreads and deeper order books. This is crucial for executing larger trades with minimal slippage.
- Volatility Rhythms: Increased participation often correlates with higher volatility. Certain sessions, especially overlaps, are known for significant price swings as competing interests clash.
- Algorithmic Behavior: Many institutional algorithms are programmed to execute during specific market hours, contributing to predictable patterns like opening range breakouts or end-of-session liquidity sweeps.
- News Impact: Economic data and corporate announcements are released according to local time zones, triggering reactions primarily from traders active during those respective sessions.
Ignoring market sessions is akin to sailing without understanding the tides. While the boat (your trade) can move at any time, understanding when the currents are strongest or weakest can drastically impact your journey.
Session Times in UTC Asia, London, and New York Explained
To standardize our understanding, we will reference all session times in Coordinated Universal Time (UTC). Traders worldwide use UTC to synchronize their analysis, especially given the various daylight saving time adjustments that occur throughout the year.
The Three Core Market Sessions
- Asian Session (Tokyo / Sydney / Hong Kong):
- Primary Drivers: Asian institutional capital, retail traders in the APAC region, initial reactions to weekend news, and early week sentiment. Often characterized by consolidation, ranging, or trending within established overnight parameters.
- Core Hours (UTC): Approximately 23:00 UTC (Sunday evening) to 08:00 UTC (Monday morning).
- Tokyo Open: 00:00 UTC
- Sydney Open: 22:00 UTC (during Australian summer) / 00:00 UTC (during Australian winter)
- Hong Kong/Singapore: 01:00 UTC
- Characteristics: Typically lower volatility compared to London or New York, tighter ranges. However, significant news from China or Japan can induce sharp moves. Liquidity can be thinner, leading to larger price impacts from individual large orders.
- London Session (European):
- Primary Drivers: European institutional capital, high-frequency trading (HFT) firms, and significant overlap with Asia and later with New York. London is a global financial hub, and its session often dictates the prevailing trend for the day.
- Core Hours (UTC): Approximately 07:00 UTC to 16:00 UTC.
- London Open: 07:00 UTC
- Frankfurt/Paris Open: 07:00 UTC
- Characteristics: Often sees a significant increase in volatility and liquidity compared to Asia. Many “fakeouts” or “liquidity sweeps” occur around the London open as early Asian session ranges are tested. It’s a prime time for trend initiation or reversal.
- New York Session (North American):
- Primary Drivers: North American institutional capital, hedge funds, and reactions to major economic data releases (e.g., CPI, FOMC, NFP). This session also brings the “New York close” which can be a critical daily closing price for many financial products.
- Core Hours (UTC): Approximately 12:00 UTC to 21:00 UTC.
- New York Open: 13:00 UTC
- Chicago Futures Open: 13:30 UTC
- Characteristics: High volatility and liquidity, especially during its overlap with London. Major trend continuation or reversals often solidify during New York hours. News events released during this session have a profound global impact.
Here’s a simplified table for quick reference, assuming standard time (without DST for clarity, always verify current times):
| Session | Primary Hours (UTC) | Key Characteristics |
| Asian | 23:00 – 08:00 | Consolidation, ranging, lower liquidity, potential sweeps |
| London | 07:00 – 16:00 | Volatility expansion, trend initiation, liquidity sweeps |
| New York | 12:00 – 21:00 | Highest volatility & liquidity, major trend continuation |
Liquidity and Volatility Patterns by Session
Understanding the ebb and flow of liquidity and volatility is central to navigating crypto market sessions.
Asian Session: Consolidation and Range Trading
The Asian session, particularly after the initial Sunday/Monday open, often acts as a period of consolidation. Price may range within a relatively tight channel, known to many as the “Asian Range.” This is due to:
- Lower Institutional Participation: Relative to European and American markets, the sheer volume of institutional capital active in Asia during these hours can be lower for globally traded assets like BTC or ETH.
- Reactionary Trading: Often, the Asian session reacts to news or price action from the previous New York close, attempting to find equilibrium before London opens.
- Liquidity Sweeps: Towards the end of the Asian session, sophisticated algorithms might engineer “liquidity sweeps” – quick probes above or below the session’s highs or lows to trigger stop losses or fill pending orders, often before a reversal into the London open.
Volatility (measured by Average True Range – ATR) for assets like Bitcoin or Ethereum tends to be lowest during these hours, though significant news from China, Japan, or Australia can override this pattern.
London Session: Volatility Expansion and Trend Initiation
The London open marks a significant inflection point. European banks and institutions enter the market, injecting substantial liquidity and often triggering increased volatility. Key characteristics include:
- Opening Range Breakouts: Price often breaks out of the Asian session’s consolidation range. Traders frequently look for these initial directional moves.
- “London Fakeout”: It’s common to see a false breakout or “fakeout” around the London open. Price might initially move in one direction, only to reverse sharply as liquidity is absorbed, trapping early movers before the “true” directional move begins. This is a classic liquidity hunt.
- Trend Confirmation/Reversal: The London session often establishes the day’s dominant trend or confirms a reversal from the Asian session’s direction.
This session generally exhibits higher ATR readings than Asia, signifying more dynamic price action.
New York Session: Peak Activity and Macro Impact
The New York session brings the highest levels of both liquidity and volatility, particularly during its overlap with London. This is due to:
- Massive Capital Pools: The sheer size of North American financial markets ensures vast amounts of capital are in play.
- Economic Calendar Impact: Major economic data releases (e.g., US CPI, FOMC minutes, NFP reports) are almost exclusively scheduled during the New York session, leading to immediate and often extreme price reactions.
- US Equity Correlation: Crypto, especially Bitcoin, often shows a heightened correlation with US equity markets (like the S&P 500 or Nasdaq) during New York trading hours.
- New York Close: The daily close of the New York session (typically 21:00 UTC or 00:00 UTC depending on chosen exchange/chart) is a psychologically important level, often dictating daily candle structure and weekly/monthly closes.
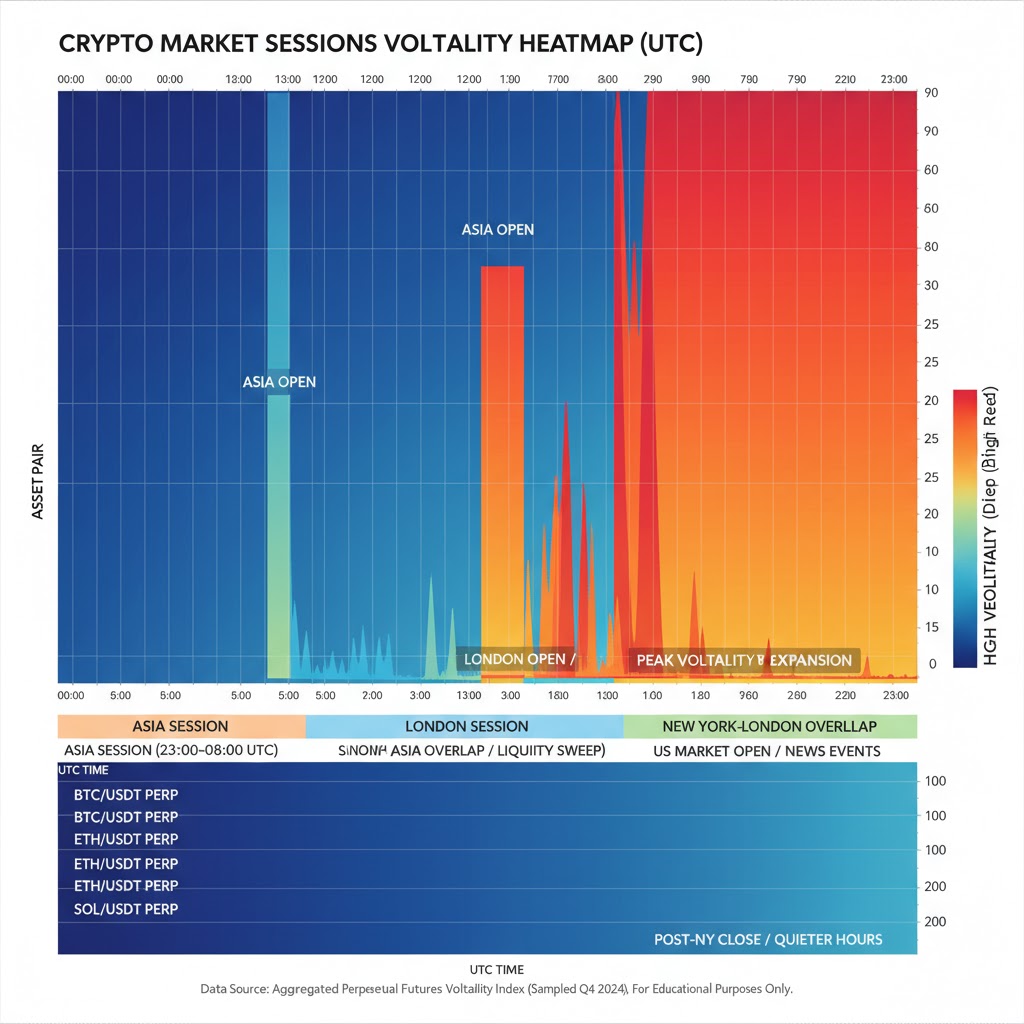
Volatility peaks during the London-New York overlap, then can gradually taper off towards the end of the New York session, leading back into the quieter Asian hours.
Here’s a visual example of how daily volatility might look across sessions for a major crypto asset like Bitcoin, using a hypothetical heatmap:
Session Overlaps Why London + New York Is the Most Active Window
Session overlaps are crucial periods where two major financial centers are simultaneously active. These windows typically exhibit the highest liquidity and volatility, as participants from both regions are engaging in the market.
Key Overlap Periods (UTC):
- Asia + London Overlap:
- Timing: Approximately 07:00 UTC to 08:00 UTC.
- Characteristics: This hour can be dynamic. Asian traders are closing positions or reacting to initial London moves, while European traders are opening. Often sees a clear breakout from the Asian range or a “fakeout” maneuver. Volume picks up noticeably.
- London + New York Overlap:
- Timing: Approximately 12:00 UTC to 16:00 UTC. (The most active 4-hour window)
- Characteristics: This is historically the most volatile and liquid period in global financial markets, and crypto is no exception. With both major Western financial hubs active, order flow is at its peak. This window frequently sees:
- Highest Volume: Deepest liquidity, tightest spreads.
- Major Trend Confirmation/Reversals: Established trends often accelerate or reverse decisively during this time.
- News Reaction: Economic data from both Europe and North America can trigger massive spikes in volatility.
- Algorithmic Frenzy: HFT algorithms are most active, contributing to rapid price discovery.
Why the London + New York Overlap is Critical
During this four-hour window, the convergence of massive capital pools, diverse trading strategies, and critical news events creates an environment ripe for significant price movements. For those analyzing intraday market structure, understanding how price behaves within this overlap is paramount. It’s often where “clean” breaks of key support/resistance levels occur, or where prior liquidity sweeps culminate in a sustained directional move.
Session Strategies Breakouts, Fakeouts, and Reversals
While this article does not provide trading signals, understanding common session patterns can inform discretionary trading decisions and risk management.
Asian Range Consolidation
- Observation: The Asian session often forms a relatively tight range.
- Context: This range can serve as a liquidity pool. Price often sweeps highs or lows of this range during the London or New York open.
- Application: Traders might identify the Asian session high and low as potential targets for future liquidity sweeps, or as initial resistance/support levels for a potential breakout later in the day.
London Open Breakout / Fakeout
- Observation: The London open (around 07:00 UTC) frequently sees aggressive moves.
- Context: Institutions entering the market often test liquidity. A common pattern is a “London fakeout,” where price moves one way (e.g., sweeps above the Asian high) only to reverse and move in the opposite direction. This traps early buyers/sellers.
- Application: Patient traders might wait for the initial volatility of the London open to subside and look for confirmation of direction after the fakeout has occurred, or use liquidity targets (e.g., previous session highs/lows) to anticipate where price might reverse.
New York Reversal Pattern
- Observation: Around the New York open (12:00-13:00 UTC) or towards the New York close (around 20:00-21:00 UTC), reversals can occur.
- Context: The New York open often re-evaluates the London session’s trend. If London moved aggressively in one direction, New York might see a pullback or full reversal, especially if conflicting economic news emerges. Towards the New York close, position squaring or end-of-day rebalancing can also induce reversals.
- Application: Traders can observe how price interacts with key levels during the London-New York overlap. A strong rejection after a major push could signal a reversal, particularly if coinciding with a significant supply/demand zone or prior high/low.
It’s crucial to remember that these are generalized patterns, not infallible rules. Always combine session analysis with robust technical analysis, risk management, and confirmation from multiple data points.
Session Highs & Lows Identifying Liquidity Targets
Session highs and lows are critical reference points for professional traders. They represent areas where significant orders (stop losses, profit targets) accumulate, making them attractive “liquidity targets” for larger market participants and algorithmic systems.
Importance of Session Extremes:
- Liquidity Pools: Beneath a session’s low or above its high, there are typically pools of stop-loss orders from traders positioned against that move. Algorithms are designed to seek out and “sweep” these pools to fill their own large orders with minimal market impact.
- Order Block References: For institutional traders, previous session highs and lows often define critical “order blocks” or supply/demand zones that can act as future support or resistance.
- Market Structure: The relationship between current price action and previous session highs/lows provides vital clues about the market’s current structure (e.g., continuation of a trend by breaking previous highs, or reversal by failing to do so).
How to Use Them:
- Marking Levels: Daily, weekly, or even monthly session highs and lows should be marked on your charts.
- Anticipating Sweeps: Understand that price often aims for these levels. A move above an Asian high during London might be a liquidity sweep before a reversal, rather than a direct breakout.
- Confirmation: Look for how price reacts when it reaches these levels. Does it reject sharply? Does it consolidate before breaking through? This interaction provides context for potential future moves.
For instance, if Bitcoin consolidates throughout the Asian session, forming a clear high, a push above that high during the London open could be a swift liquidity sweep before price reverses to the downside, especially if it quickly fails to hold above it. This is a common “stop hunt” before the real move.
Funding Times and Perpetual Futures Schedules (UTC Reference)
Perpetual futures are a dominant instrument in crypto trading, offering leverage and allowing traders to speculate on price movements without an expiry date. A unique feature of perpetual futures is the “funding rate” mechanism, which ensures the perpetual contract price remains anchored to the spot price.
Funding Rate Mechanics:
- Mechanism: Every 8 hours (on most major exchanges like Binance, Bybit, OKX), a funding payment occurs. If the perpetual price is above the spot price (positive funding), longs pay shorts. If below (negative funding), shorts pay longs.
- Purpose: This mechanism prevents a persistent divergence between the perpetual and spot prices.
- Market Impact: The lead-up to and immediate aftermath of funding payments can sometimes see increased volatility or liquidity adjustments as traders open/close positions to avoid paying/receiving funding, or as arbitrageurs rebalance their books.
Standard Funding Schedule (UTC):
The most common funding times for perpetual futures on major exchanges are:
- 00:00 UTC (End of the London/Start of the Asian session)
- 08:00 UTC (Mid-Asian/Start of the London session)
- 16:00 UTC (Mid-New York/End of the London session)
These times align with significant shifts in global trading activity, making them notable for observing potential short-term volatility. While not always a guaranteed volatile event, traders should be aware of these times, especially when holding leveraged positions. Analyzing historical funding rates can also provide insight into market sentiment (e.g., consistently positive funding indicates bullish sentiment from leveraged longs).
Risk Management Across Sessions Timing and Exposure Control
Effective risk management is paramount in all trading, but session timing adds another layer of consideration, especially in the volatile crypto markets.
Adjusting Risk Based on Volatility:
- Asian Session: Given its typically lower volatility, position sizing might be adjusted for narrower stop losses or smaller trade sizes if expecting consolidation. Be wary of thinner liquidity, which can lead to magnified slippage.
- London Open & Overlaps: These periods bring increased volatility. Wider stop losses might be necessary to avoid being prematurely stopped out by fakeouts or liquidity sweeps. Conversely, reduced position sizing can help manage the increased risk exposure.
- New York Session (especially overlap): This is the highest volatility period. Maximum caution is advised around major news releases. Consider reducing exposure or avoiding trading altogether during high-impact news windows if you are sensitive to sudden, large price swings.
Defining “Killzones” for Action
The concept of “Killzones” (popularized in ICT-style trading) refers to specific high-probability windows within sessions where significant market moves are anticipated. These are not about generating signals but about focusing attention during periods of peak liquidity and volatility.
- Asian Killzone (approx. 00:00 – 02:00 UTC): Early Asian session activity and setup of the Asian range.
- London Killzone (approx. 07:00 – 09:00 UTC): London open volatility, potential fakeouts and trend initiation.
- New York Killzone (approx. 12:00 – 14:00 UTC): New York open, London/New York overlap, and peak volatility.
These zones are not rigid, but serve as guides for when to be most attentive to charts.
Journaling and Backtesting
To truly master session-based risk management, diligent journaling of trades, noting the session and time of entry/exit, is crucial. Backtesting strategies with session filters can reveal how specific setups perform during different hours, allowing for refinement and adaptation. Always use risk limits and backtesting to validate session-based strategies, recognizing that historical performance is not indicative of future results.
News and Macro Events FOMC, CPI, and Asia-Led Sentiment Shifts
Economic news and macro events act as catalysts, injecting sudden volatility and often disrupting typical session patterns. Understanding when and where these events occur is critical for risk management.
Impact by Session:
- Asian Session: Major economic data from China, Japan, or Australia (e.g., PBoC interest rate decisions, Japanese CPI, Australian employment data) can cause significant localized volatility in crypto, especially for pairs heavily traded in Asia. Geopolitical events in the APAC region can also trigger sentiment shifts that cascade globally.
- London Session: European Central Bank (ECB) announcements, UK CPI, or other European economic indicators can influence crypto, particularly due to the strong correlation between European financial markets and global risk assets.
- New York Session: This is arguably the most impactful session for macro news. Key US economic data releases, such as:
- Consumer Price Index (CPI): Inflation data.
- Federal Open Market Committee (FOMC) Meetings/Minutes: US monetary policy.
- Non-Farm Payrolls (NFP): US employment data.
- Producer Price Index (PPI): Producer-level inflation.
These events can trigger immediate, violent price swings in crypto, often overriding any existing technical patterns.
Strategies for News Events:
- Check Economic Calendars: Always consult an up-to-date economic calendar (e.g., Investing.com, Forexfactory.com) set to UTC.
- Reduce Exposure: Consider reducing position size or closing trades entirely before major news events if you are sensitive to high-impact volatility.
- Wait for Volatility to Subside: Often, the initial reaction to news is highly erratic. Patient traders might wait for the first 15-30 minutes after a release for the market to digest the information and establish a clearer direction.
- “Buy the Rumor, Sell the News”: While not a trading signal, this adage highlights that markets often move in anticipation of news, with reversals occurring once the news is actually released.
Understanding the potential impact of scheduled news events and how they align with market sessions is a cornerstone of intelligent risk management.
Session Tools Heatmaps, VWAP Bands, and Backtesting Indicators
Leveraging the right tools can significantly enhance your ability to analyze and trade around market sessions.
Volatility Heatmaps
- Function: Visual representations of asset volatility across different hours of the day.
- Application: These help traders identify at a glance which hours typically have the highest (red) or lowest (blue) volatility for specific assets, reinforcing the concepts of session overlaps and quiet periods. Tools like CoinGlass often provide this data for crypto assets.
Session Volume Weighted Average Price (VWAP) Bands
- Function: VWAP is a trading benchmark, representing the average price an asset has traded at throughout the day, weighted by volume. Session VWAP resets at the start of each new session (e.g., Asian VWAP, London VWAP).
- Application: Traders use VWAP and its standard deviation bands as dynamic support and resistance levels. Price tends to revert to VWAP. Deviations from VWAP (e.g., touching the outer bands) can signal overextension and potential reversals or continuations. Resetting VWAP for each session provides a fresh context for intraday price action.
Backtesting Indicators and Platforms
- Function: Backtesting allows traders to test strategies against historical data. Many advanced charting platforms and coding environments (e.g., TradingView with Pine Script, Python with backtesting libraries) allow for session-specific filters.
- Application: You can backtest how a specific breakout strategy performs only during the London open, or how a reversal strategy fares during the New York close. This empirical approach is essential for validating any session-based trading hypothesis and building confidence in your approach.
Dedicated Session Indicators
Many platforms offer indicators that automatically highlight session highs/lows, mark session opening/closing times, and even color-code chart backgrounds based on the active session. These visual aids simplify the process of tracking session dynamics.
Remember that tools are only as effective as the analysis behind them. They aid in visualizing and quantifying session behaviors, but critical thinking and continuous learning remain paramount.
Conclusion
The crypto market, despite its 24/7 nature, is deeply influenced by the rhythmic breathing of global financial sessions. The ebb and flow of liquidity and volatility across the Asian, London, and New York trading hours create discernible patterns that, while not guaranteeing profits, provide invaluable context for understanding price action. From the consolidating Asian range to the volatile London open and the high-liquidity New York overlap, each session brings its unique characteristics and opportunities for informed analysis.
Mastering these session dynamics means recognizing when to expect higher volatility, where liquidity pools are likely to form, and when major news events are poised to disrupt established patterns. It’s about developing a keen awareness of timing as a critical variable in market behavior. By aligning your observation and risk management strategies with these global rhythms, you move beyond simply watching charts and begin to truly understand the underlying market microstructure. Time is a variable in every trade mastering it is mastering context.