Imagine walking into a bustling souk, a vibrant, chaotic marketplace where the air hums with the energy of a thousand simultaneous negotiations. Vendors call out prices for their wares, buyers haggle, and the final price of a beautiful rug isn’t written in stone—it’s determined in that very moment by the push and pull of desire and supply. This ancient scene is not so different from the modern financial markets. While we trade from sleek screens instead of dusty alleyways, the core principles remain the same. Every price you see on your chart—for a currency pair, a stock, or a cryptocurrency—is the result of a complex, global conversation. Understanding this conversation, the very market structure that governs it, is the single most important edge a trader can have. It’s the difference between being a tourist in the souk, easily parted from your money, and being a savvy merchant who understands the flow of goods, the mood of the crowd, and the true value of what’s being traded. This article is your guide to becoming that savvy merchant. We will demystify the trading infrastructure that powers platforms, break down the language of prices, and reveal how concepts like liquidity flow and market depth directly impact your bottom line. Whether you’re trading Forex, crypto, or indices, the rules of the game are written in the language of bid/ask spread, leverage and margin, and pips and lot size. Let’s learn to speak it fluently.
The Grand Bazaar An Introduction to Market Structure & Pricing
At its heart, a financial market is nothing more than a mechanism for connecting buyers and sellers. Market structure refers to the architecture of this mechanism: the platforms, the rules, the participants, and the processes that determine how prices are discovered and trades are executed. Why should you care? Because the structure dictates your experience. It determines your costs (the spread), your potential for profit and loss (leverage), and the very likelihood that your order will be filled at the price you expect. A day trader scalping the EUR/USD lives in a different part of the market ecosystem than a long-term investor buying Apple stock, and their success depends on understanding their specific environment. The foundational concepts we’re about to explore—bid, ask, spread, and liquidity—are the building blocks of this entire structure. They are the universal constants, the grammar of the market’s language. Mastering them is your first step towards trading with confidence and clarity.
The Price of a Trade Bid Ask and Spread
This is the most fundamental concept in all of trading. If you remember only one thing from this article, let it be this.
The Car Dealership Analogy
Imagine you’re at a car dealership. The sticker price on the windshield is $30,000. This is the Ask Price—the price at which the dealer (the seller) is asking you to buy the car.
Now, you walk in and make an offer. You say, “I’ll give you $27,000 for it.” This is your Bid Price—the price you are bidding to buy the car for.
The difference between the dealer’s ask ($30,000) and your bid ($27,000)—that $3,000 gap—is the Spread. In financial markets, this spread is not a one-time negotiation; it’s a constant, dynamic feature of every single asset.
Defining the Trio
-
Bid Price: The highest price a buyer is willing to pay for an asset at a given moment. It’s your sell price. If you want to sell your Euros for US Dollars, you will sell at the Bid.
-
Ask Price (or Offer Price): The lowest price a seller is willing to accept for an asset. It’s your buy price. If you want to buy Euros with US Dollars, you will buy at the Ask.
-
Spread: The difference between the Ask and the Bid. It is the immediate, built-in cost of entering a trade. The market must move in your favor by at least the amount of the spread for you to break even on a round-trip (buy and sell) trade.
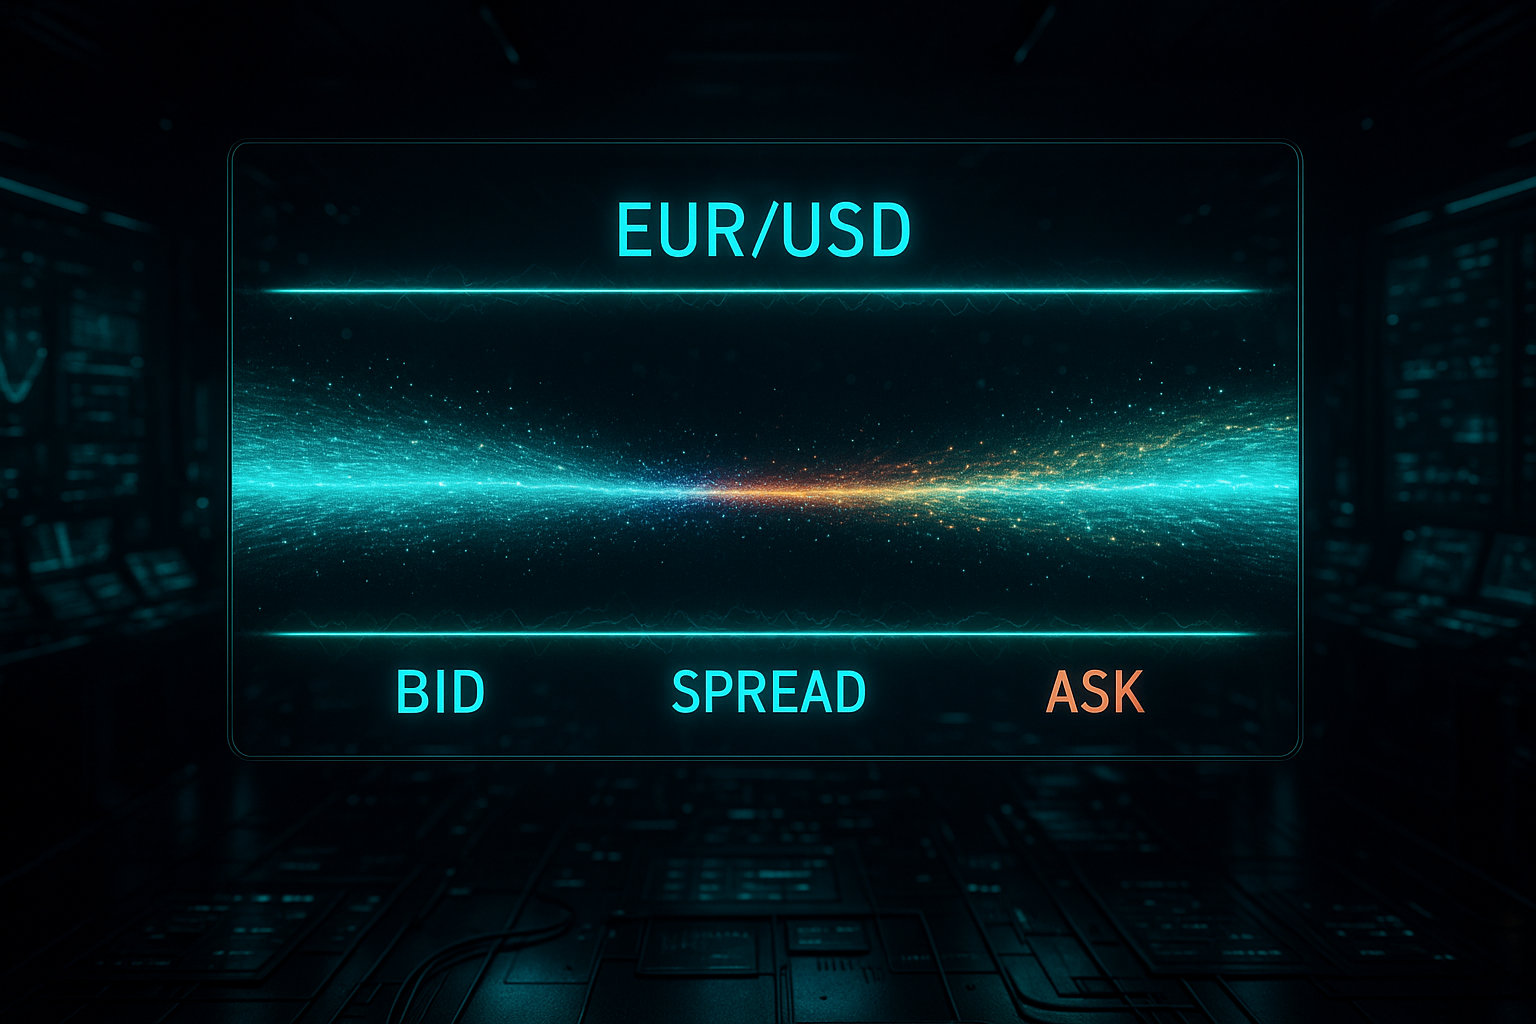
Example in Forex:
Let’s look at the EUR/USD pair.
-
Bid: 1.0850
-
Ask: 1.0852
The spread here is 2 pips (we’ll cover pips soon). This means if you buy at 1.0852 (the Ask), the price must rise to 1.0852 just for you to break even if you sold immediately at the Bid. The spread is the broker’s or market maker’s compensation for facilitating the trade.
What the Spread Tells You: Tight vs. Wide
The spread is a vital sign of market health.
-
Tight Spreads: Common in highly liquid, heavily traded instruments like major Forex pairs (EUR/USD, USD/JPY) or large-cap stocks. A tight spread indicates a crowded, efficient market with lots of buyers and sellers. It’s cheap to get in and out. This is the smooth, well-paved highway of trading.
-
Wide Spreads: Common in illiquid markets, like exotic currency pairs (USD/TRY, EUR/SEK), small-cap stocks, or during off-market hours and major news events. A wide spread indicates a thin market with fewer participants. It’s a higher cost to trade and suggests higher volatility and potential for slippage (your order filling at a worse price than expected). This is the rocky, unpaved back road.
Understanding how bid ask spread works in trading is your first lesson in cost-awareness. Always know your cost of doing business before you even place a trade.
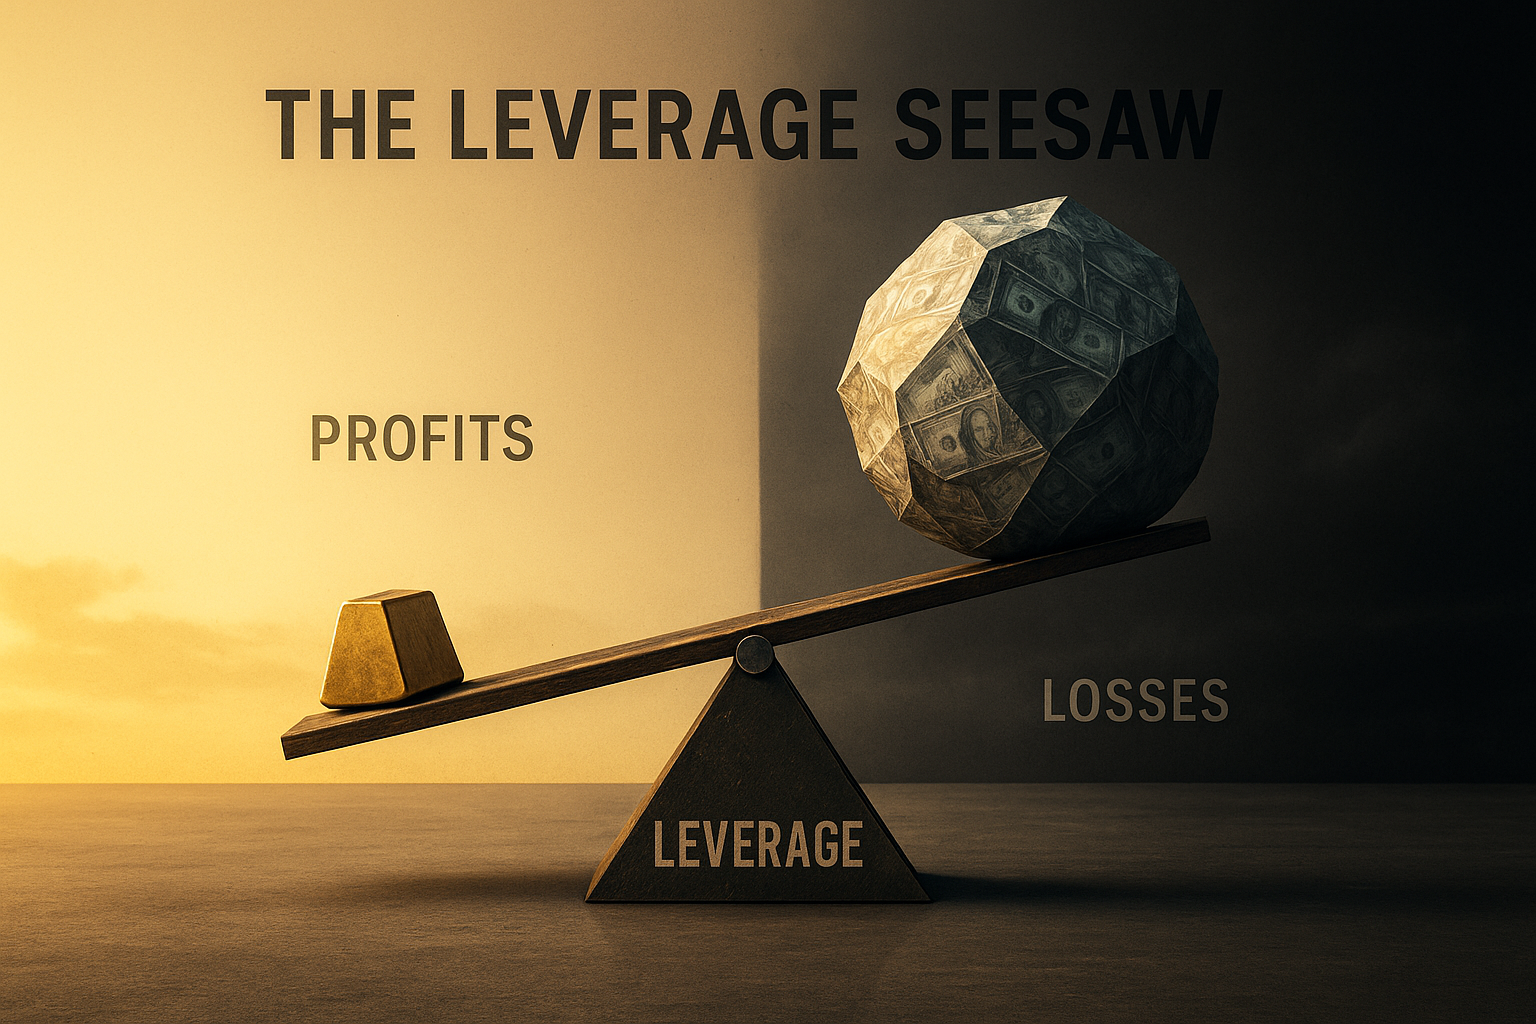
The Double-Edged Sword Leverage and Margin
Leverage is perhaps the most seductive and dangerous tool in a trader’s kit. It allows you to control a large position with a relatively small amount of capital. It’s the financial equivalent of using a crowbar to lift a boulder you couldn’t move with your bare hands.
The House-Buying Example
You want to buy a $500,000 house. You don’t have $500,000 in cash, but you have $50,000 for a down payment. The bank lends you the remaining $450,000. You are now using 10:1 leverage. You control a $500,000 asset with only $50,000 of your own money.
If the house’s value increases to $550,000, your equity is now $100,000 ($550k – $450k mortgage). You’ve doubled your initial investment! This is leverage amplifying your gains.
But if the house’s value drops to $450,000, your equity is gone. You’ve lost your entire $50,000 down payment. This is leverage amplifying your losses.
The Trading Definitions
-
Leverage: The ratio of borrowed funds to your own capital. It’s expressed as a multiple, like 10:1, 50:1, or 500:1.
-
Margin: The amount of your own capital that you must deposit to open and maintain a leveraged position. It’s your “good faith deposit” or collateral for the loan. In the house example, the $50,000 down payment was your margin.
-
Margin Call: A warning from your broker that your trade is moving against you and your remaining capital (your equity) is no longer sufficient to hold the position. If you don’t add more funds, the broker will automatically close your trade to prevent further losses.
A Concrete Example with Numbers
Let’s say you have $1,000 in your trading account. You see a great opportunity on EUR/USD and want to buy 1 standard lot (100,000 units). Without leverage, you’d need $100,000. That’s not possible.
But your broker offers 50:1 leverage. This means you only need to put up 1/50th of the total value as margin.
-
Required Margin: $100,000 / 50 = $2,000.
Wait, you only have $1,000. So, you can’t open a 1-lot position. You could open a 0.5 lot position, requiring $1,000 in margin.
Now, let’s say the trade moves in your favor by 1% (a common move).
-
1% of $50,000 (0.5 lots) = $500 profit.
That’s a 50% return on your $1,000 account in a single trade!
Conversely, if it moves against you by 1%:
-
1% of $50,000 = $500 loss.
That’s a 50% loss of your account in a single trade.
Risk management with leverage and margin is not optional; it’s essential.
-
Actionable Tip: Never use your full available leverage. Use it as a tool to trade smaller position sizes relative to your account, not to maximize size. A common rule of thumb is to risk no more than 1-2% of your account on any single trade.
The Units of Measurement Pips and Lot Size
To measure price movements and calculate profits and losses, traders use standardized units.
What is a Pip?
A “pip” (Percentage in Point) is the standard unit for measuring how much an exchange rate has changed. For most currency pairs, a pip is the fourth decimal place.
-
If EUR/USD moves from 1.0850 to 1.0851, it has moved 1 pip.
-
For pairs involving the Japanese Yen (JPY), a pip is the second decimal place (e.g., a move from 110.50 to 110.51 is 1 pip).
With the rise of 5-digit pricing, you now often see “pipettes” or fractional pips (the fifth decimal place). But the core concept remains the same.
What is a Lot Size?
A “lot” is the standardized quantity of a financial instrument you trade. It’s the contract size. In Forex, we have:
-
Standard Lot: 100,000 units of the base currency.
-
Mini Lot: 10,000 units.
-
Micro Lot: 1,000 units.
-
Nano Lot: 100 units (offered by some brokers).
The ability to trade micro and mini lots has been a game-changer for retail traders, allowing for precise risk management with leverage and margin.
Bringing It All Together: A Profit/Loss Calculation
Let’s trade GBP/USD.
-
You buy 1 standard lot (100,000 GBP) at an Ask price of 1.2750.
-
The spread is 2 pips, so the Bid price is 1.2748.
-
The price rises, and you decide to sell at a Bid price of 1.2800.
Your Profit:
-
Find the pip movement: 1.2800 (Sell Bid) – 1.2750 (Buy Ask) = 0.0050, which is a 50 pip move.
*Note: You bought at the Ask and sold at the Bid, so you must account for the spread. The market moved 52 pips from your entry Bid to your exit Bid, but your net gain is 50 pips after the 2-pip cost.* -
Calculate the monetary value. The value of a pip for a standard lot is approximately $10 (for pairs where USD is the quote currency).
-
Profit = Pip Gain x Pip Value x Lot Size
-
Profit = 50 pips x $10 per pip x 1 lot = $500.
-
This practical example of pip and lot size explained for beginners shows how these abstract units translate directly into real money.
The Auction Never Ends Price Formation
So, where do these prices actually come from? Price formation is the dynamic process of discovering an asset’s value through the continuous interaction of buy and sell orders.
The Core Mechanism: Supply and Demand
It’s the most basic law of economics, and it’s the engine of the markets.
-
When buyers (demand) outnumber sellers, they are willing to pay higher and higher prices to get filled. The price goes up.
-
When sellers (supply) outnumber buyers, they are forced to offer lower and lower prices to find a buyer. The price goes down.
Every tick on your chart is a record of a transaction where a buyer and a seller agreed on a price at a specific moment in time.
The Catalysts: News, Events, and Human Emotion
The balance of supply and demand is constantly shifted by new information.
-
Economic Data: A strong US jobs report might increase demand for the US Dollar, pushing EUR/USD down.
-
Corporate Earnings: A company beating earnings estimates will see increased demand for its stock.
-
Geopolitical Events: Uncertainty often leads to a “flight to safety,” increasing demand for assets like gold or government bonds.
-
Market Sentiment: Greed and fear are powerful, tangible forces. A rising market can attract more buyers (FOMO – Fear Of Missing Out), while a falling market can trigger panic selling.
Price formation in Forex and crypto markets is particularly fascinating because it’s a 24-hour global auction. When London opens, volume and volatility in EUR pairs pick up. When London overlaps with New York, the market is at its most liquid. When Asia is the only major center open, action can be quieter. Understanding these rhythms is part of understanding price action.
The Lifeblood of the Markets Liquidity Flow
Liquidity is the ease with which an asset can be bought or sold without significantly affecting its price. Think of it as the “thickness” of the market.
-
A Liquid Market: Like a deep, wide river. You can throw in a large boulder (a big order) and it will be absorbed with barely a ripple. The bid-ask spread is tight. Major Forex pairs and large-cap stocks are highly liquid.
-
An Illiquid Market: Like a shallow stream. Tossing in a small pebble (a modest order) can cause a significant splash, moving the price against you. Spreads are wide, and slippage is common. Exotic currency pairs and low-volume stocks are illiquid.
Why Liquidity Flow Matters
Liquidity flow and its importance in trading cannot be overstated. It is the “why” behind price movements. Large, institutional orders from banks, hedge funds, and corporations are the primary drivers of liquidity flow. When a pension fund decides to sell a billion euros, that order doesn’t hit the market all at once. It’s sliced into smaller chunks and executed by algorithms, creating a persistent selling pressure that can move the market for hours. As a retail trader, you are a tiny fish in this ocean. Your goal is not to fight the current, but to swim with it. Recognizing the signs of large liquidity flow—such as sustained, high-volume moves or the absorption of large orders at certain price levels on the market depth chart—can give you a significant edge.
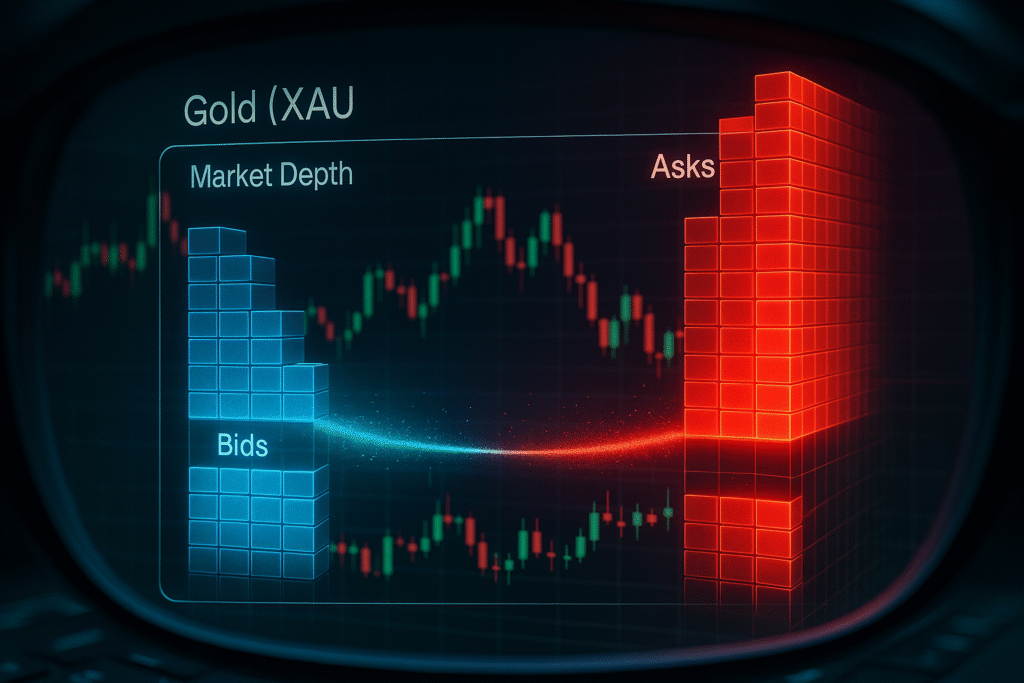
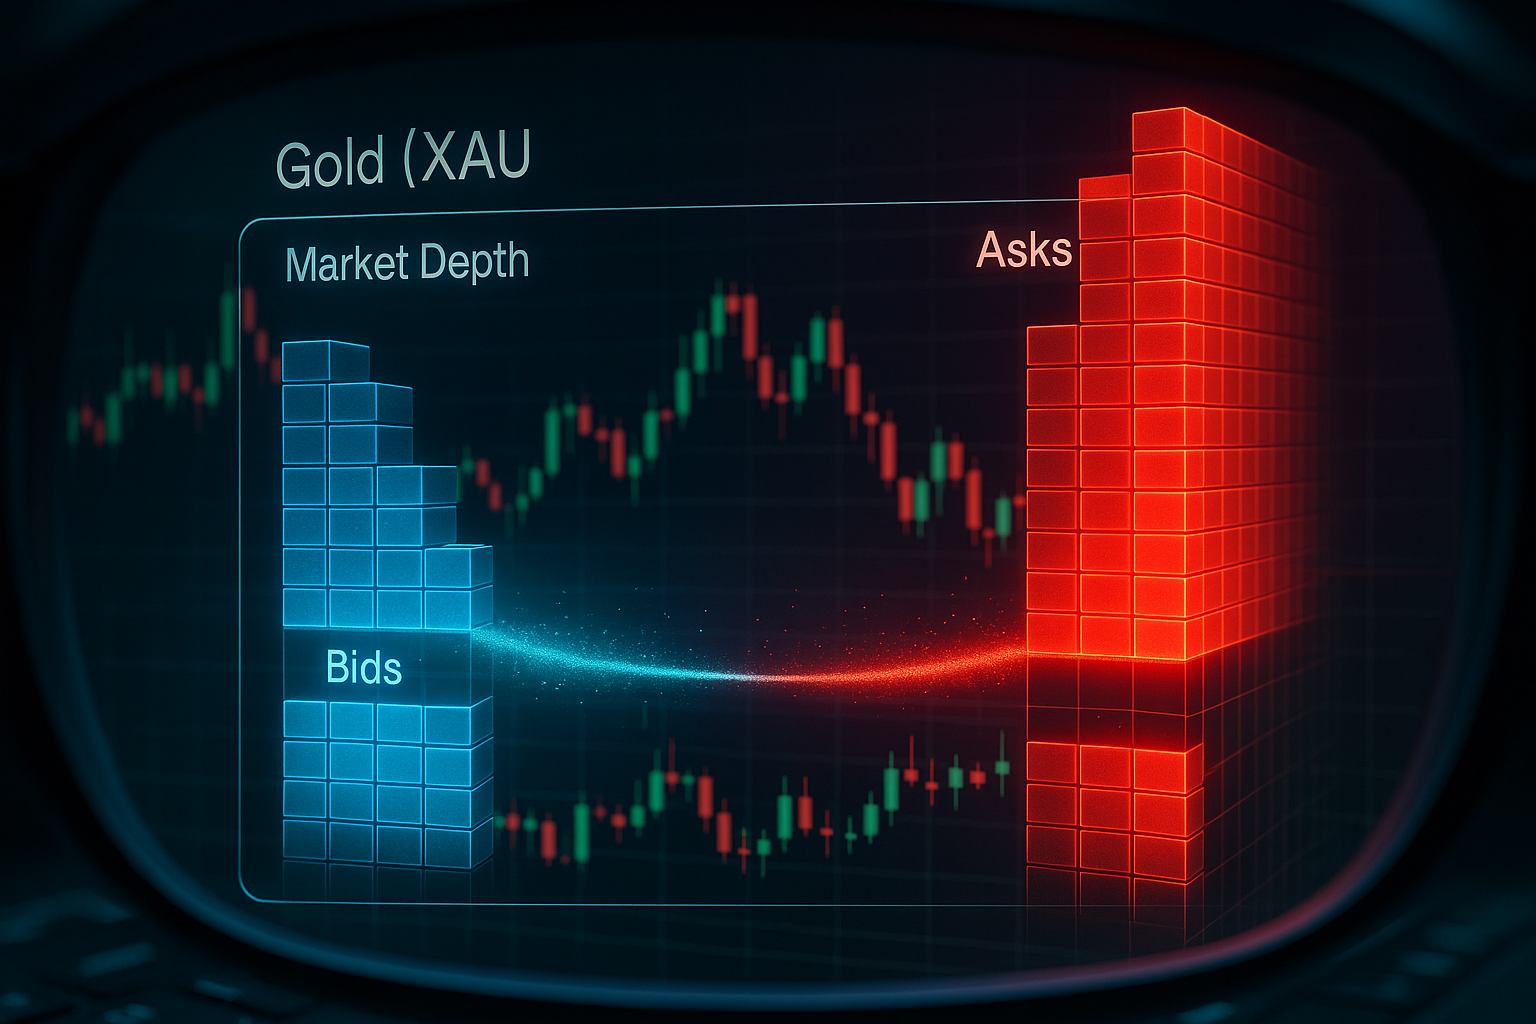
Seeing Beneath the Surface Market Depth
If the price chart shows you where the market has been, the market depth window (also known as the Level 2 data or the Order Book) shows you where it might be going.
The Order Book Explained
The order book is a real-time list of all pending buy and sell orders for an asset, organized by price level. It’s typically displayed as two columns:
-
Bids (Buy Orders): On the left, showing the volume (amount) buyers are willing to purchase at each price level below the current market price.
-
Asks/Offers (Sell Orders): On the right, showing the volume sellers are willing to sell at each price level above the current market price.
How to Read the Story in the Book
Market depth and order book analysis is like reading the matrix. It reveals the hidden battle between buyers and sellers.
-
Large “Walls”: If you see a massive sell order of 500 BTC at $60,000, that price level becomes a significant resistance. Buyers will need immense force to “eat through” that wall. Conversely, a large buy wall acts as strong support.
-
Imbalances: If the volume on the bid side is significantly larger than on the ask side at the current levels, it suggests buying pressure is building, and the price is more likely to break upwards.
-
Spoofing: Be aware that large orders can sometimes be “spoofs”—placed to create a false impression of support/resistance and then canceled before they are filled. Experience helps you distinguish real intent from deception.
Market depth directly impacts your trading through slippage. If you place a market order to sell when there are very few buyers at the current price, your order will “walk down” the order book, filling at successively lower prices, resulting in negative slippage.
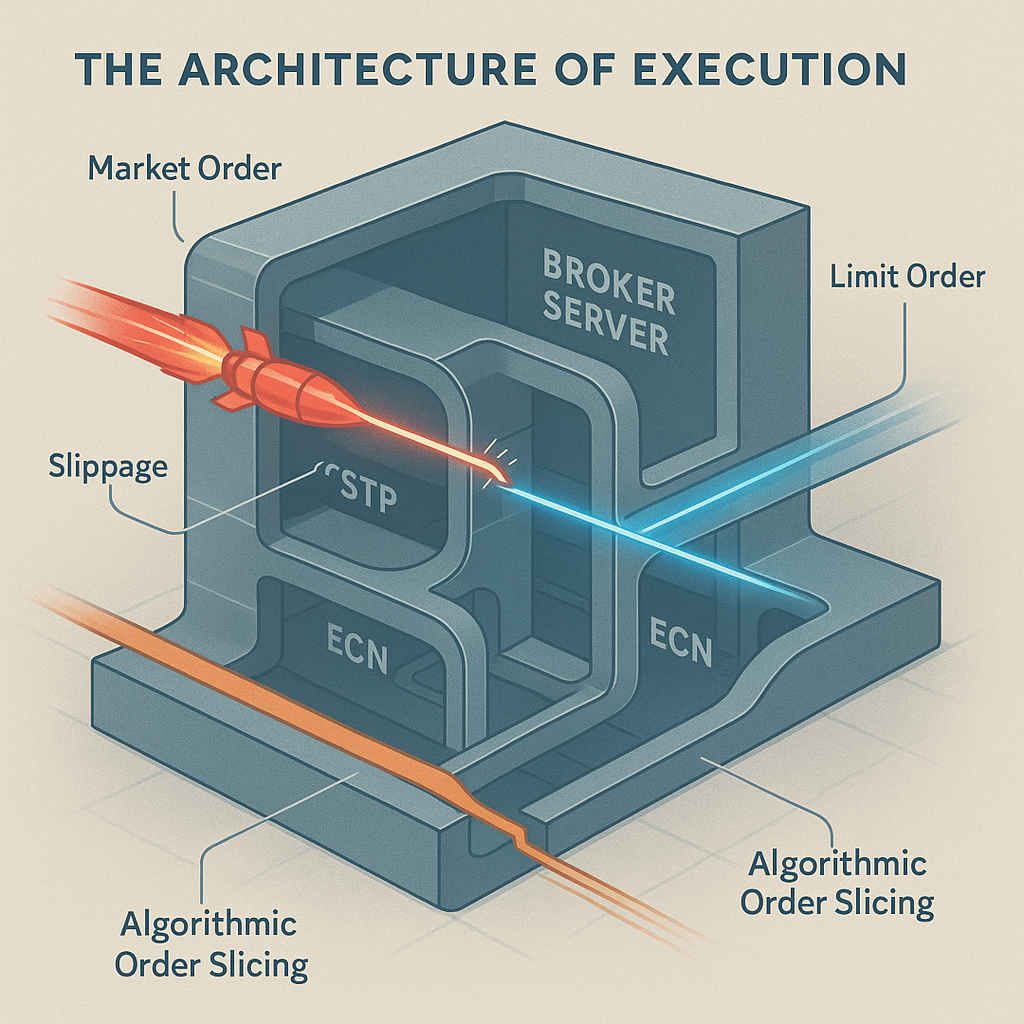
Choosing Your Gatekeeper Broker Models
Not all brokers are created equal. Their underlying business model profoundly affects your trading costs and execution quality. Understanding different broker models and execution types is crucial for choosing the right partner.
1. The Market Maker (MM) or Dealing Desk Model
-
How it Works: The broker acts as the counterparty to your trades. When you buy, they are selling to you from their own inventory. They create a market for you.
-
Pros: Often fixed spreads, which can make cost calculation easier for beginners. May offer guaranteed stop-losses.
-
Cons: Inherent conflict of interest. The broker may profit from your losses. During high volatility, requotes (where the broker asks you to accept a new price) are common, and execution can be slower.
2. The Straight Through Processing (STP) Model
-
How it Works: The broker routes your orders directly to their liquidity providers (usually large banks and financial institutions) without a dealing desk.
-
Pros: No conflict of interest, as the broker makes money from a mark-up on the spread (a commission). Better execution than Market Makers.
-
Cons: Spreads are variable and can widen significantly during news events.
3. The Electronic Communication Network (ECN) Model
-
How it Works: The broker connects you to a central network where multiple liquidity providers (banks, MMs, other traders) compete to fill your order. You see the raw, aggregated market depth from various sources.
-
Pros: Highest level of transparency. Tightest possible raw spreads. True market pricing.
-
Cons: You pay a separate commission on top of the raw spread. The trading platform infrastructure is typically more complex and can be intimidating for beginners.
Tips for Choosing: Scalpers and high-volume traders will gravitate towards ECN/STP models for the low costs and fast execution. Newer traders might start with a reputable STP broker. Always check a broker’s regulatory status and read the fine print on their execution policy.
Giving the Command Execution Types
An order is your instruction to the market. The type of order you use is a strategic decision that can dramatically alter the outcome of your trade.
The Common Order Types
-
Market Order: An order to buy or sell immediately at the best available current price. It’s about speed, not price. Use it when you must get into or out of a trade now. You accept the risk of slippage.
-
Limit Order: An order to buy or sell at a specific price or better. A Buy Limit is placed below the current price, specifying the maximum you are willing to pay. A Sell Limit is placed above the current price, specifying the minimum you are willing to accept. It’s about price control, not speed. The trade-off is that it may not get filled.
-
Stop Order (Stop-Loss / Stop-Entry):
-
Stop-Loss: A market order that triggers after a specified price is reached, designed to limit a loss on a position.
-
Buy Stop: An order to buy that is placed above the current market price, often used to enter a breakout trade.
-
Sell Stop: An order to sell that is placed below the current market price.
-
-
Fill or Kill (FOK): An order that must be executed immediately in its entirety, or not at all.
The importance of speed, latency, and slippage is paramount here. The physical distance between your broker’s servers and the exchange’s matching engine can mean the difference between a filled limit order and a missed opportunity. This is the world of high-frequency trading, but even retail traders benefit from brokers with robust, low-latency trading platform infrastructure.
From Theory to Practice Trading Tips & Strategies
Knowing the theory is useless without a practical application. Let’s weave these concepts into a coherent trading approach.
A Scenario: Trading a News Event
The US is about to release Non-Farm Payrolls data. You expect a strong number, which should be bullish for the USD.
-
Pre-News:
-
You notice the spread on EUR/USD is widening dramatically (from 1 pip to 10 pips). This is a warning sign of illiquidity and high volatility. A market order here would be extremely costly.
-
You check the market depth and see that the order book is very thin—large liquidity providers have pulled their quotes.
-
-
Strategy:
-
Instead of a risky market order, you set a Sell Stop order below the current range. You accept that you might miss the very first spike, but you ensure you only enter if the market actually moves in your predicted direction.
-
You calculate your position size using a micro lot to ensure your risk management with leverage and margin is sound, risking no more than 1% of your account.
-
You set a tight stop-loss just above your entry point.
-
-
Post-News:
-
The news is released, it’s strong for the USD, and EUR/USD plummets. Your Sell Stop is triggered.
-
Due to the volatility, you experience some slippage, but because you used a stop order (which becomes a market order upon triggering) and your position size was small, the impact is minimal.
-
The trade moves in your favor. You measure your profit in pips and, because you sized your lot size correctly, you secure a nice gain that is meaningful for your account size but doesn’t expose you to catastrophic risk.
-
This holistic approach—considering cost (spread), risk (leverage/lot size), execution (order type), and context (liquidity)—is the hallmark of a professional mindset.
The Evolving Landscape A Glance at Emerging Concepts
The world of trading infrastructure is not static. Technology continues to evolve, creating new paradigms. Concepts like Event Trading and Rhythm Trading are becoming more sophisticated, using algorithms to capitalize on predictable market patterns around scheduled events or time-based liquidity shifts. Platforms are constantly innovating to provide faster, more transparent access to global liquidity flow. Some, for instance, are integrating features that streamline the entire process from analysis to execution, potentially referencing the all-in-one approach seen in platforms like MexQuick, which aim to consolidate various tools and data streams into a single, efficient interface for the modern trader. The core principles of market structure, however, remain the timeless foundation upon which all these innovations are built.
Conclusion: Your Journey as an Informed Trader
We’ve traveled from the basic definitions of bid and ask to the complex interplay of liquidity flow and market depth. You now understand that the spread is a cost, leverage is a powerful but dangerous tool, and that every pip of movement tells a story of supply and demand. The financial markets are the most democratic arena in the world, but they are not a charity. They transfer wealth from the uninformed to the informed. By understanding market structure & pricing, you are arming yourself with the knowledge needed to navigate this arena successfully. Your journey doesn’t end here. Open a demo account with a broker that offers transparent broker models and execution types. Practice reading the order book. Place trades with a focus on how your orders are filled. Become a student of the market’s rhythm and structure. The souk is open 24 hours a day. Now, you have the map. Go forth and trade with knowledge, discipline, and respect for the market’s immense power.